Trend analysis
The evaluation shows the trend in transactions and amounts for each paymethod.
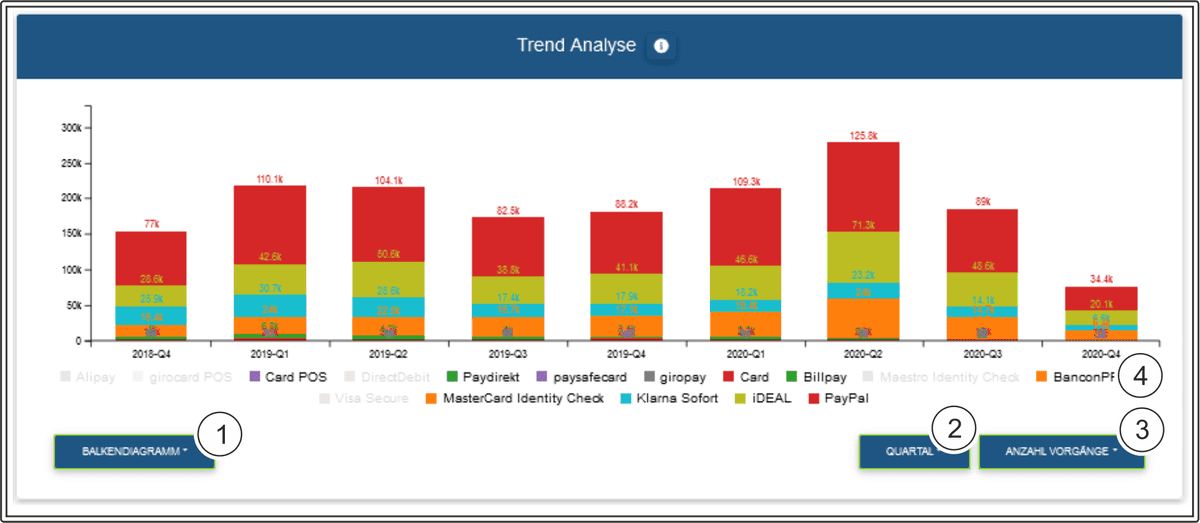
Select line chart, bar chart, curve chart and area chart as the chart type
Select display by year, quarter, month, week and date as intervals
Display by types of operation: authorised amount, captured amount, refunded amount and number of operations
Paymethods
Interval
The interval "Date" shows the daily trend for the last 2 weeks.
Paymethods
You can hide individual paymethods by clicking on them. Clicking on them again makes the paymethod appear. The paymethods that have been greyed out are hidden, and are not shown in the chart.

You can have a list of the number for each paymethod shown by moving the mouse over the respective bar in the chart.
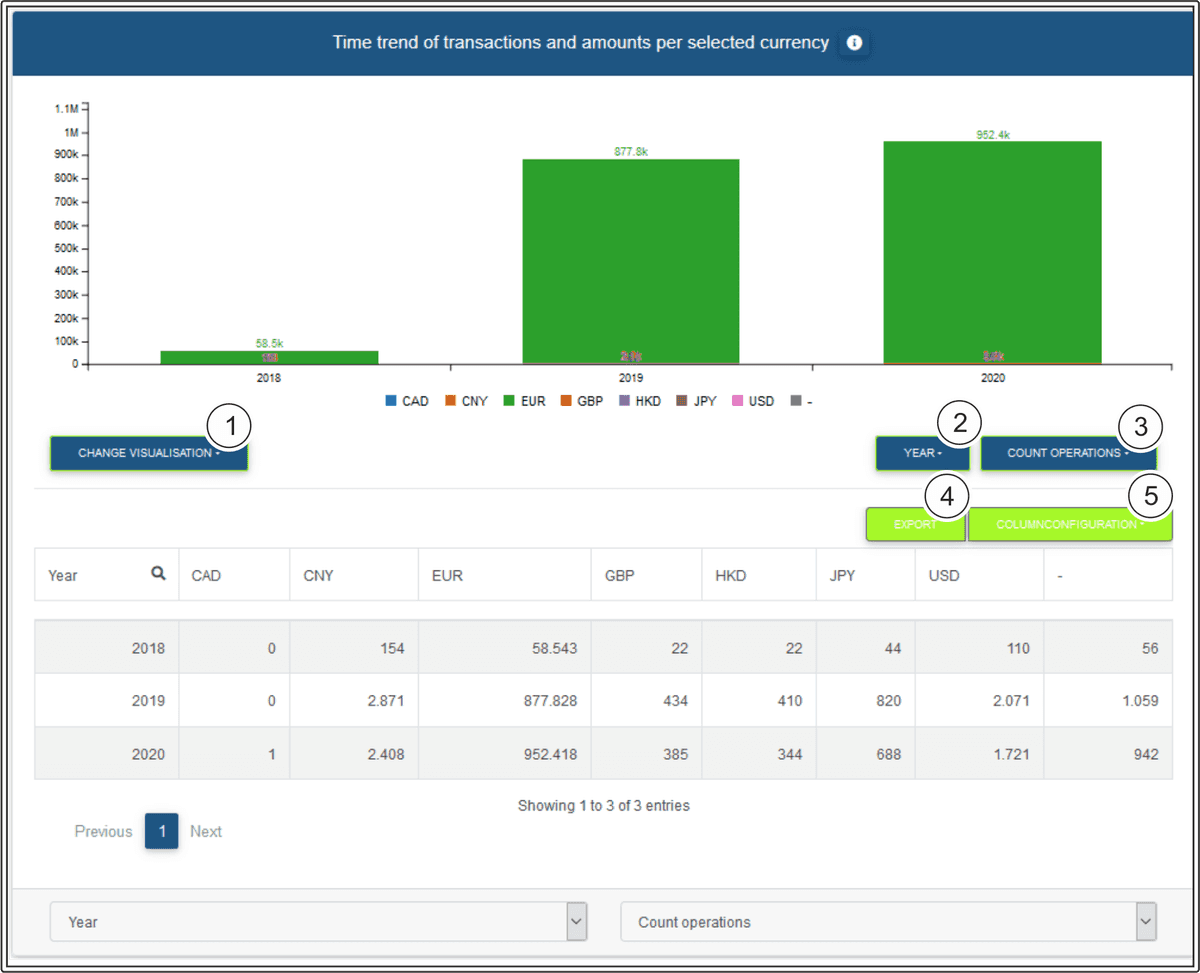
Time trend of your transactions and amounts by currency
The evaluation shows the time trend for the transactions and amounts for each year.
Currency
Select the following types of chart: line chart, bar chart, curve chart and area chart
Select display by year, quarter, month, week and date as intervals
Display by types of operation: authorised amount, captured amount, refunded amount and number of operations
Export the current table contents as an Excel file
Configure column configuration
Search function for each column
Currency
You can hide individual currencies by clicking on them. Clicking on them again makes the currency appear. The currencies that have been greyed out are hidden, and are not shown in the chart.
Column configuration
You can use the "Column configuration" button to configure columns individually. The column headings highlighted in green are shown. Clicking them allows you to hide the columns shown. In turn, you can make the hidden column headings, which are highlighted in white, appear by clicking them.